SimCapture On-Premise Enterprise: How to use reporting
Table of Contents
- SimCapture Cloud Release Notes
- SimCapture Cloud Administrator and Faculty Help
- SimCapture Cloud Learner Help
- SimCapture On-Premise Help
- SimCapture for Skills Help
- SimCapture Mobile Camera App
- SimCapture Companion Apps Help
- SimCapture Integrations Help
- Samaritan Help
- SimCapture Cloud Use Cases
- Hardware and Network Technical Information Help
- Glossary
With SimCapture Enterprise On-Premise, the Administrator who has the correct permissions has a wide choice of reports related to Usage, Event (Annotation), Assessment, and Batch reports to choose from.
- System Set-Up Course Release Settings
- Report Page Overview
- Usage Reports
- Assessment Reports
- Batch Reports
System set-up: Course release settings
The System Administrator can choose which reports are delivered by clicking the gear icon and going to Reports to Release under Configuration. While this setting is global, administrators will still need to enable Course Release Settings in their individual Courses.
Report page overview
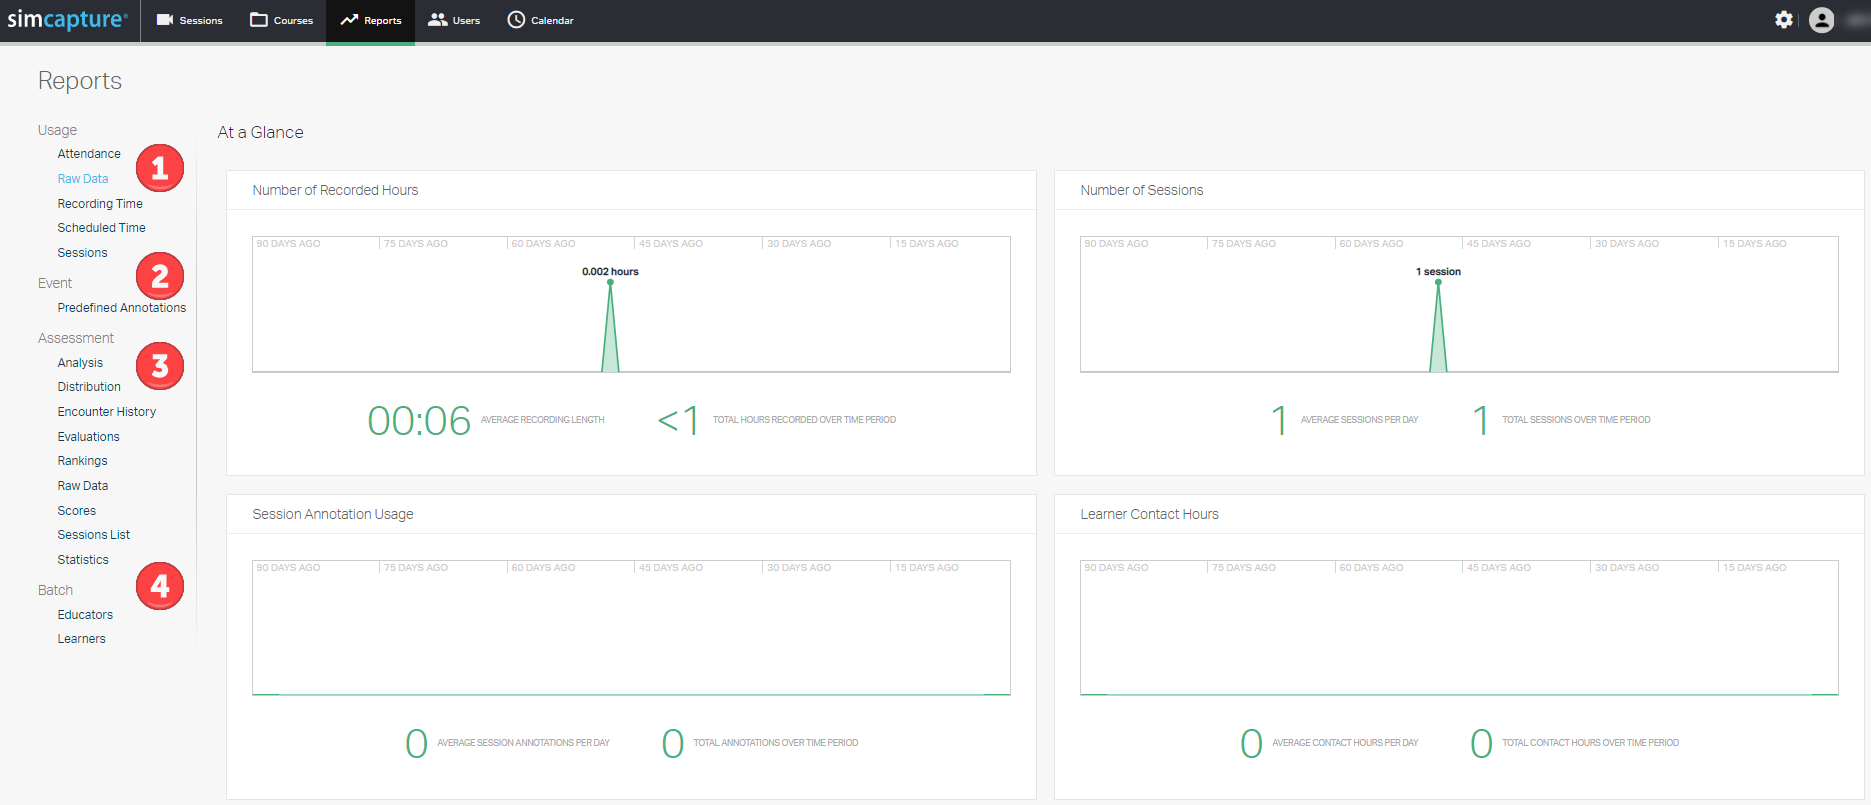
At a glance, reporting provides an overview of Recorded Hours, Number of Sessions, Annotation Usage, and Learner Contact Hours. There is no functionality associated with these images other than that is seen.

Usage Reports - provides operational data related to Attendance, Center Sign-in, Raw data, Recording Time, Scheduled Time, and Sessions.
Event Report - data related to the use of Predefined Annotation usage in course scenarios.
Assessment Reports - data related to Evaluations containing points and/or percentages and session data with associated scoring.
- Batch Reports - selection of reports that are configurable and can be exported in a .zip file.
Usage reports
Usage reports show various data from the system relating to how much/often items are utilized. This includes the Attendance report in addition to data related to Recording, Scheduling Time, and Sessions can also be reported.
Attendance reports
These reports track On-Time, Late, or No-show and are available only if you use Center Sign-In as an added feature to SimCapture Enterprise.
To access the Attendance Reports, click Reports on the global navigation bar and select Attendance from the Usage field. From that point, take these steps to run your reports.
- Choose a Summary All Events, No-Show Event, Late by Event, or Summary by Event report from the Report Type dropdown.
- Filter your report by one or many of the following:
- Date Range
- Course
- Scenario
- Organization
- Simulators
- Locations
- Inventory
- Participant Type
- Select Download as PDF, Open in Browser, or Download as Excel for your report output type.
Center sign-in reports
The Center Sign-In report shows the total number of hours that users signed into the center. To find these reports, navigate to the Reports tab and select Center Sign-In from the Usage field. Next, choose your report type and filters, select the output type Download as PDF, Open in Browser, or Download as Excel to view the report.
Raw data reports
The Raw Data report will provide detailed Excel formatted reports of usage data related to Sessions, Schedule, Inventory, and Center Sign Ins.
To find these reports, navigate to and select the Raw Data report from the Usage field. Then, select Sessions from the Report Type dropdown, and select the Date Range. Next, select your filters and then click Download as Excel to get your file.
Recording time reports
Reports the total hours of recorded sessions related to Overall, By User, By Organization, By Location, By Course, and By SimCapture.
Scheduled time reports
The Scheduled Time report displays the total hours of scheduled sessions on the calendar. This is dependent on the sessions being reserved on the calendar, and appropriate data is included in the reservation.
To find these reports, navigate to and select the Scheduled Time report from the Usage field. Then, select one of the following as the report type: Overall, By User, By Location, By Course, By SimCapture, or By Inventory. Finally, select the filters you want to apply, choose the report output type and then view your report.
Sessions reports
Session reports display the total number of sessions. This report is similar to the Scheduled Time report and is run the same way. However, the By Inventory selection is not available from the Report Type dropdown.
Event reports
The Event Report provides data on the usage of Predefined Annotations within Scenarios and throughout Sessions.
To find these reports, navigate to and select Predefined Annotations from the Event field. Then choose from the following report types:
- By Scenario – the number of scenarios this annotation appears in vs. the number of total scenarios.
- By Session – the number of sessions in which each annotation was created vs. the total number of sessions where the annotation was available to be created.
- Total – provides the same data as By Session and includes a count of the total number of times an annotation was utilized in a Session.
Continue by applying your filters and then click Download as PDF.
Assessment reports
Assessment Reports are related to various statistical information for each user. Therefore, these reports can be as detailed as you'd like them to be.
Analysis reports
The Analysis reports show how many users received full/partial/no credit for each question and which answer was chosen. These reports can help identify which questions users struggle with or identify bad questions.
To find these reports, navigate to and select Analysis from the Assessment field. Then, select your Report Type, apply your filters, and choose whether you want to download the report as a PDF, an Excel spreadsheet, or, if you'd like to, view it in a browser.
Note that the eye icon can be selected to edit the reports' display options.
![]()
Distribution reports
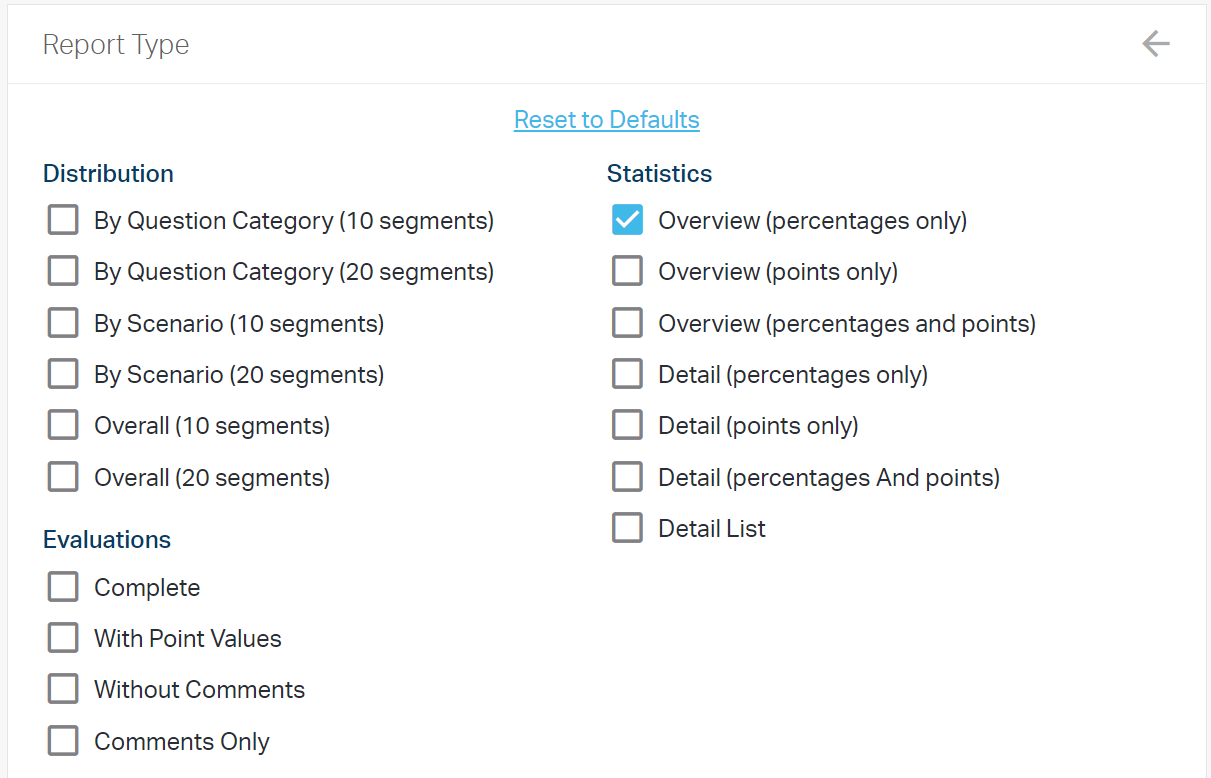
Distribution reports present a pipe graph representing score distribution in five (20 segments) or ten (10 segments) point increments. Report Type options include Question Category, Scenario, or Course.
To find these reports, navigate to and select Distribution from the Assessment field.
Then, select the Report Type from the dropdown, apply the filters you want to use, and select the output format of PDF, Excel, or view in Browser to view the report.
Encounter history
For organizations utilizing Standardized Patients, the Encounter History report provides information about the encounter history between students and the standardized patient. Report types include Count and By Date.
Note: This report is only applicable if you are using the CCM module.
To find these reports navigate to and select Encounter History from the Assessment field. Then, select the Report Type from the dropdown, apply the filters you want to use, and select the output format of PDF, Excel, or view in Browser to view the report.
Note: For this report, a Course and/or Users filter must be applied.
Evaluations
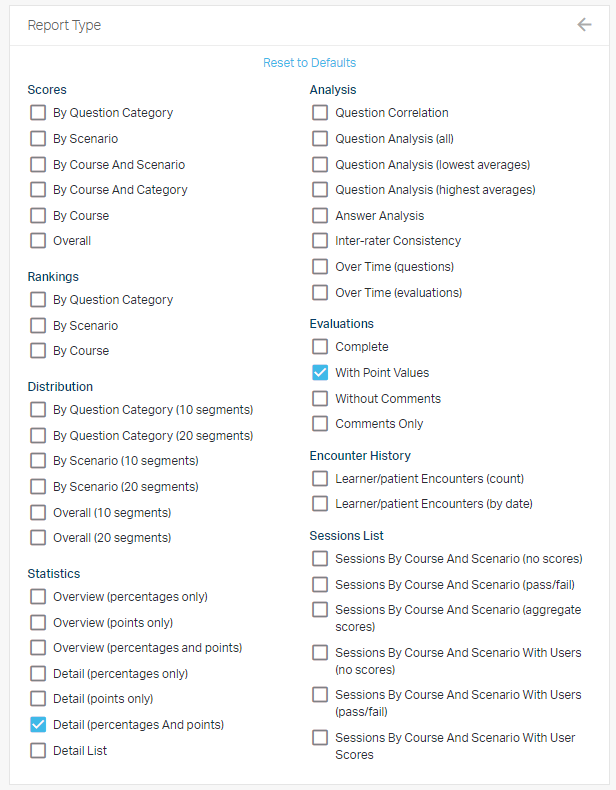
Evaluation reports provide a PDF report of Completed Evaluations, Completed Evaluations with Point Values, Completed Evaluations without Comments, and Comments Only. This report will provide data on each participant individually for the evaluation(s) selected. If multiple evaluations exist within a course, it is best to select the specific Evaluations or User filter to view.
To find these reports navigate to and select Evaluations from the Assessment field. Then, select the Report Type from the dropdown, apply the filters you want to use, and generate the PDF report.
Rankings
Ranking reports show participants’ scores comparatively. Report Types include Rankings by Question Category, By Scenario, or By Course.
To find these reports navigate to and select Rankings from the Assessment field. Then, select the Report Type from the dropdown, apply the filters you want to use, and select the output format of PDF, Excel, or view in Browser to view the report.
Raw data
Raw Data can be exported into Excel format for further evaluation. The data is related to Question Points, Selected Answers with Totals, Answer Index, Full answer Text, and Comments.
To find these reports navigate to and select Raw Data from the Assessment field. Then, select the Report Type from the dropdown, apply the filters you want to use, and select Download as Excel.
Score reports
The Scores report shows participants’ scores in percentage form. Report Type includes By Question Category, By Scenario, Course and Scenario, Course and Category, By Course, and Overall.
To find these reports navigate to and select Scores from the Assessment field. Then, select the Report Type from the dropdown, apply the filters you want to use, and select the output format of PDF, Excel, or view in Browser to view the report.
Sessions list report
The Sessions list report will provide data related to Users and Courses in Excel format. This report contains data that is shown in the Scores report and the Statistics report.
To find these reports navigate to and select Sessions List from the Assessment field. Then, select the Report Type from the dropdown, apply the filters you want to use, and select Download as Excel.
Statistics report
The Statistics Report contains various statistical information for each user and includes mean and cutoffs for all Evaluations in a Course and Scenario. This report is critical and will provide the most data.
To find these reports navigate to and select Statistics from the Assessment field. Then, select the Report Type from the dropdown, apply the filters you want to use, and select the output format of PDF, Excel, or view in Browser to view the report.
Batch reports
Batch reports will download a .zip file of statistical data for Educators or Learners. An individual folder for each Learner can be created.
Educators
To use these reports, navigate to and select Educators from the Batch field. Then, from the Batch Options field, select the Report Type and then click Download as Zip.


Learners
The Learner's batch report is run just like the Educator's batch report, but different filters are available, as shown below.

