SimCapture Enterprise : Rapports sur l'utilisation des compétences
Découvrez comment SimCapture Enterprise peut fournir des rapports détaillés sur l'utilisation des compétences au sein de votre organisation, vous permettant de suivre et d'analyser plus efficacement le développement et les performances des employés.

Written by Jeri Ellis
Updated at August 29th, 2025
- Notes de version de SimCapture Cloud
- Aide à l'administrateur et au corps professoral SimCapture Cloud
- Aide SimCapture Cloud Learner
- Aide SimCapture sur site
- Aide SimCapture pour les compétences
- Aide de l'application SimCapture Mobile Camera
- Aide des applications compagnons SimCapture
- Cas d'utilisation SimCapture Cloud
- Aide aux intégrations
- Aide aux informations techniques sur le matériel et le réseau
- Glossaire
- Samaritan Help
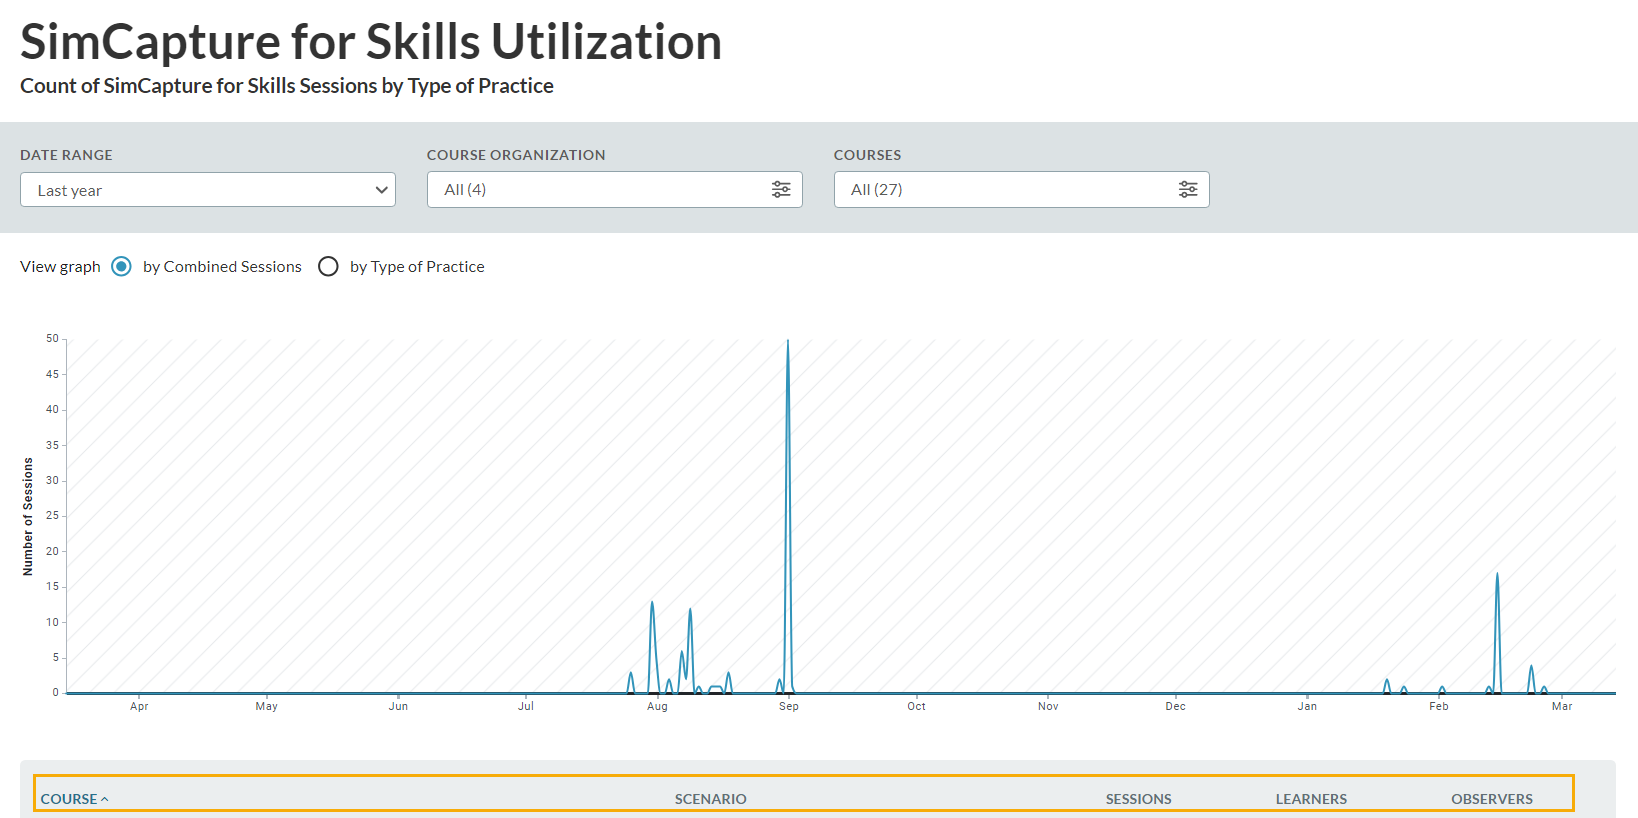
Le rapport d'utilisation des compétences de SimCapture fournit aux administrateurs un aperçu des différents types de sessions utilisées par les apprenants, comme les sessions entre pairs, les sessions d'auto-enregistrement et les sessions d'auto-apprentissage. Voici un aperçu de l'accès et de l'utilisation de ce rapport.
Accéder au rapport d'utilisation des compétences
- Accédez à Rapports dans la barre de navigation globale.
- Cliquez sur le rapport SimCapture pour les compétences .
Caractéristiques principales
- Répartition des sessions : affichez le nombre et le type de sessions utilisées par les apprenants.
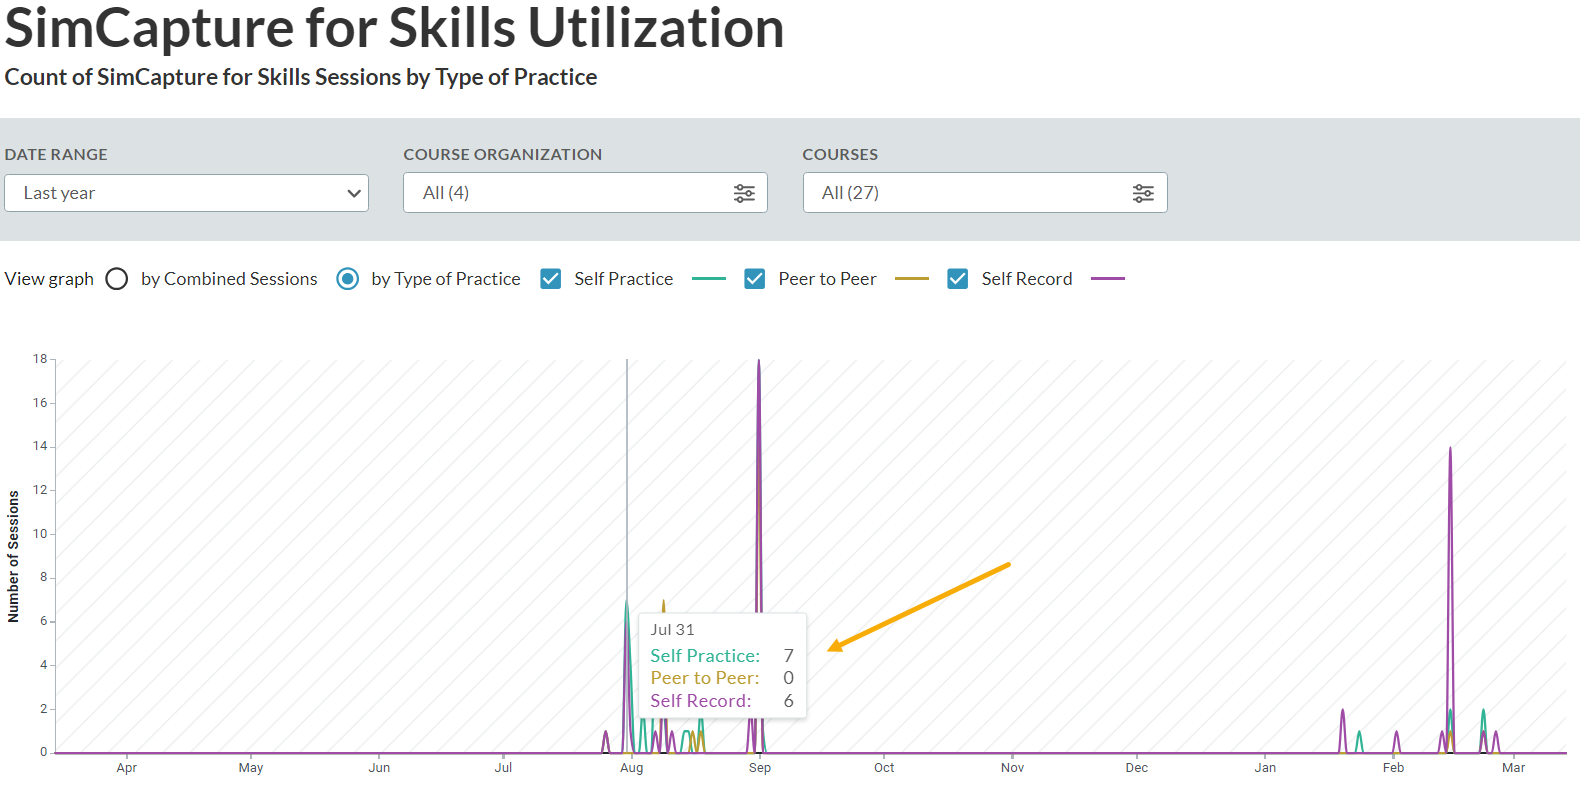
- Types de sessions :
- Sessions combinées : un résumé de tous les types de sessions.
- Type de pratique : Se concentrer sur des types de séances spécifiques :
- Peer-to-Peer : affiché en vert sur le graphique.
- Pratique personnelle : Représenté en doré.
- Auto-enregistrement : affiché en violet.
Filtres : Affinez les données par plage de dates , organisation du cours et cours .
Graphique interactif : passez la souris sur les lignes pour voir le nombre de sessions par type.
Tableau détaillé : sous le graphique, affichez des détails tels que le cours , le scénario , les sessions , les apprenants et les observateurs en fonction de vos filtres.